The Effect on Average Per Capita Energy
One of the interesting, though very high-level, ways to measure of global wealth is to calculate the average energy available to each person on earth. While the resulting per capita average doesn't reflect the disparity between rich and poor individuals or nations or let us know what sorts of things people might do with their energy endowments, it can give us a general feeling for how "energy-wealthy" the average global citizen is, especially compared to other times.
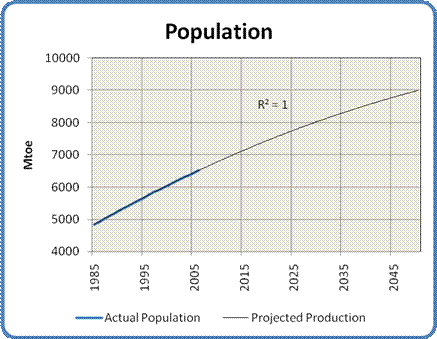
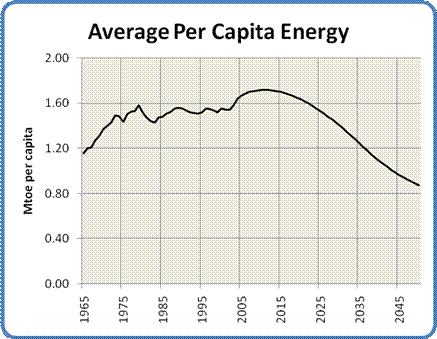
Fortunately, the energy analysis we have just completed gives us the tool we need to establish this measure. By simply dividing the total energy available in each year by that year's population we can construct the graph shown in Figure 16.
As you can see, the rising population and falling energy supply combine to produce a falling per capita energy curve. In fact, if these models of energy and population are correct, we can expect to see a drop of almost 50% in average per capita energy by 2050, from 1.7 toe/person to 0.9 toe/person. Each person alive in 2050 will have available, on average, only half the energy they would have today.
The Effect on Countries
Unfortunately the world is not a uniform place, and measures like "average per capita energy" don't really tell us much about how the world might look in 2050. To gain a bit more insight it is helpful to think of the world as being composed of rich and poor nations, where their wealth is characterized by their total energy consumption and whose population growth is expressed in their Total Fertility Rate.
An interesting insight appears when you sort the world's nations by their per capita energy consumption. The nations and regions at the bottom of the consumption scale (Africa, Bangladesh, India, Pakistan, Peru, Indonesia and much of Southeast Asia) all have very high fertility rates, well over the replacement rate of 2.1 children per woman. In fact, when normalized for population size, the average TFR of the poor nations is 3.0. In contrast, the group containing all the other nations is well below the replacement fertility rate at around 1.8.
The implication is that poor nations are going to face double jeopardy. Their populations will increase even as their already low energy consumption drops further. In addition, as per capita energy consumption drops world-wide, some nations that are not currently considered "energy-poor" will be impoverished enough to join the group at the bottom, thereby swelling its ranks even further.
The Growing Divide Between Rich and Poor
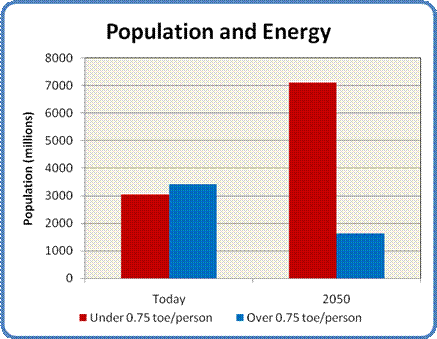
In order to get some idea of the magnitude of this effect, I have associated each of the 63 countries or regional groupings in this analysis with their current population, total current energy consumption and their population in 2050. I have arbitrarily decided that a per capita consumption of 0.75 toe/yr is the dividing line between between poverty and wealth. 0.75 toe/yr is a bit less than half the present world average, and only one tenth of the energy consumed by an average American.

The countries and regions that currently fall below that poverty line include Bangladesh, Philippines, Pakistan, India, Peru, Indonesia, Ecuador, Colombia, Egypt, much of Africa, many Asian Pacific nations and some Eurasian countries. Altogether they have a population of about 3 billion people. The rest of the world's nations, from Algeria to Kuwait, are in the rich half of 3.5 billion people.
In order to assess the effect of declining average per capita income, I decided to spread the pain evenly. The assumption is that most countries will see a similar drop in their level of energy consumption. While that expectation may not be completely realistic, it seems close enough for the purpose of this exercise. The result is that countries with a per capita consumption between 0.75 and 1.5 toe/person will lose enough energy to be counted in the group of poor nations.
The countries and regions that drop from rich to poor status include Algeria, Turkey, Mexico, Thailand, much of Central and South America, the non-oil-producing nations of the Middle East, and - most significantly - China.
When we add up the populations in 2050 of the rich nations that are left, it comes out to only 1.6 billion. Remember, their populations fell due to lower fertility, there are fewer of them and they lost China to the ranks of the poor.
The population of the poor nations is where the shock comes. Their total population in 2050 adds up to over 7 billion people. That number is more than the total population of the Earth today, all living at an energy level somewhere between Bangladesh and Egypt.